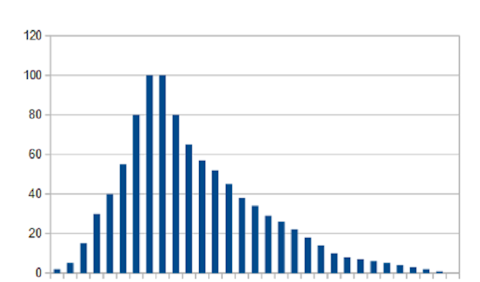
Based on the Dunedin Study.

This graph shows one year increments from biological age 30 to biological age 58.
All of the people measured were 38. 38-39 is where the tall bars are.
It's clear the many people age before their time.
![]()
Some people age much less quickly than others.
The people who age less give a damn. They are described as conscientious by the researchers.
The don't smoke or take drugs.
They use alcohol in a moderate way.
They try to eat a good diet.
They try to exercise a bit.
They are socially engaged.

This graph shows one year increments from biological age 30 to biological age 58.
All of the people measured were 38. 38-39 is where the tall bars are.
It's clear the many people age before their time.
![]()